Who’s Financially Better Off Under The Current Government?
[p-lead]David Cameron was on the radio today declaring that UK families are better off under the current government.
Yet the facts seem to tell a different story.[/p-lead]
According to a report from the Institute of Fiscal Studies, on average families are £1,127 worse off than under the previous parliament. The report is entitled The effect of the coalition’s tax and benefit changes on household incomes and work incentives.
The purpose of the study is outlined as follows: “The coalition government has introduced a large number of tax and benefit changes during its five years in office. In this briefing note, we examine the effect of all these changes on households’ disposable incomes. In other election briefing notes, we will describe these changes, their individual merits and how they change the shape of the tax and benefit system as a whole.”
The “squeezed” middle classes often get mentioned but it seems that the two ends of the earning spectrum have been the biggest losers under the coalition. Some have of course seen above average reductions to their incomes, while others have made small gains. The study’s executive summary states:
[well]
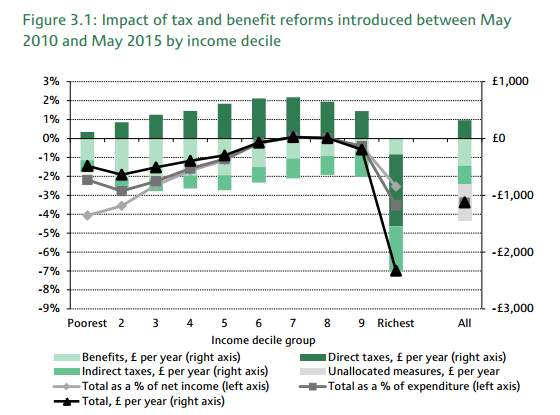
“Low-income working-age households have lost the most as a percentage of their income from tax and benefit changes introduced by the coalition, mainly as a result of benefit cuts. However this changes if we include in our analysis the tax rises introduced immediately before the coalition came to office (the first element of the fiscal consolidation that began in April 2010): the richest households have lost the most both in cash terms and as a percentage of income from the overall tax and benefit changes that have taken place since the beginning of 2010. Including these tax rises increases the average loss to households to £810 per year.”
[/well]
The only households that seem to have significantly benefited are those with no children and two earners. The following graph shows how the changes to tax and benefits have affected incomes, from the poorest to the richest:
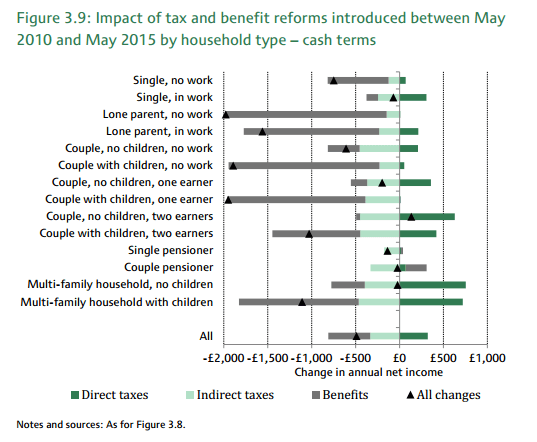
Because of losses to benefits (the grey bars) we can see from the following graph that it is single jobless parents, out-of-work couples with children and families with children and only one-earner. Many would deem this unfair, that those with children and therefore added expenses have lost out most, though the government has argued vehemently for these cuts to benefits:
The study concluded, in somewhat pessimistic fashion, that no matter the makeup of the next government, we will probably be seeing the trends in benefits reduction and tax rises continue:
[well]
“Looking ahead, there will be a continued need for fiscal consolidation in the next parliament, and it is likely that at least some of this will be delivered through tax rises or cuts to social security spending to reduce the implied cuts to ‘unprotected’ departments in current spending plans.30 Based on what the three main UK parties have told us about their plans so far, it seems that at least some of the trends we have seen over the last five years are likely to continue whoever forms the next government.”
[/well]